 I’ve written enough posts now to ‘write a book’ 🙂 …so it’s about time I dealt with a seemingly sacred cow – the ‘Balanced Scorecard’.
Context
First, I’ll delve into a bit of history…
Robert Kaplan and David Norton performed a research project back in 1990 in respect of measuring organisational performance.
It was based on the premise that:
- An organisation’s knowledge-based assets1 were becoming increasingly important;
- The primary measurement system remained2 the financial accounting system; and
- Executives and employees pay attention to what they measure and, therefore, were overly focused on the (short term) financials and insufficiently on the (longer term) intangible assets.
 The outcome of their research project was the concept of a Balanced Scorecard of measurements (and, of course, the accompanying Harvard Business School (HBS) management book).
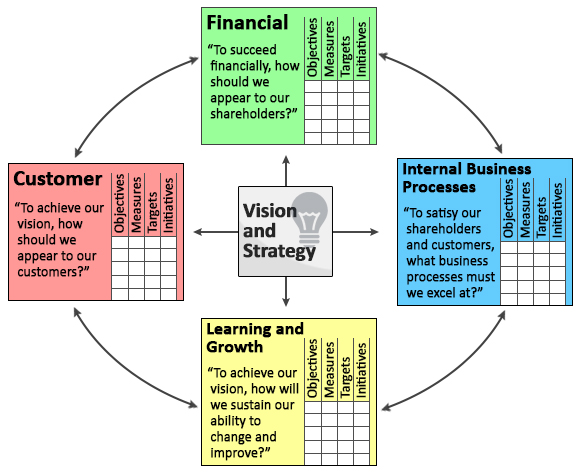
This retained the organisation’s financial measures (as historic results) but added three additional perspectives:
- Customer;
- Internal Business Processes; and
- Learning & Growth.
The last two were said to represent the lead indicators of future financial performance.
The Balanced Scorecard quickly gained traction in many corporations. This was helped by many a ‘big consultancy’ cashing in3 on the lucrative ‘implementation’ revenue stream.
Version 2.0
Over a decade later (2004) Kaplan and Norton then took things further by linking strategy formulation and execution to their measurement ideas and came up with the Strategy Map concept (and, you’ve guessed it…an accompanying HBS management book). I imagine that this was for two reasons:
1. They saw some improvements to/ holes in the original idea;
…and with my cynical hat sat jauntily on my head…
2. They now had an adoring following that would buy the sequel which, as ever, sets out:
– the big idea in detail;
– a set of carefully curated case studies; and
– instructions on how to implement ‘the big idea’ in (on?) your organisation
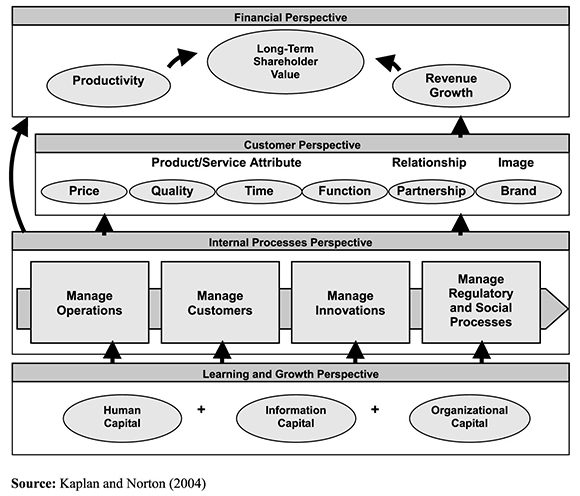 The ‘Strategy Map’ turned the four quadrants of the balanced scorecard into a linear cause-effect view (see picture)
The idea went that the desired financial outcomes would be stated at the top, which would then be achieved by reverse engineering down the strategy map to the bottom.
Thus, through setting objectives from top down to bottom and using measures, targets and action plans (involving initiatives with business cases and budgets), the desired outcome could be achieved.
Wow, that all looks really cool – neat looking and oh-so-complete! Doesn’t it?
So why the ‘Sacred Cow’ reference?
Well, many (most?) organisations feverishly adopted the Balanced Scorecard/ Strategy Map tools and technique as if it were common sense. Indeed, some 20 years later, it has become ‘part of the management furniture’. Unquestioned…even unquestionable.
However, I believe that there are a number of serious problems within…so let’s consider whether that proverbial sacred cow deserves to be slaughtered…
There are two angles that I could come at it from:
- The thinking within the Balanced Scorecard/Strategy Map logic; and
- How organisations typically implement these ‘big ideas’.
It would be too easy to shoot at how organisations typically implement them (i.e. how they might have bastardised it4)…and you could easily accuse me of ‘cheap shots’, saying that these aren’t Kaplan and Norton’s fault. So, instead, I’ll critique the foundational logic using four headings.
Here goes…
1. Measurement:
The foundation of Kaplan and Norton’s logic is that we must have measures if we are to manage something…and this is regarded as conventional wisdom…but here’s a counter-quote from W. Edwards Deming to ponder:
“Of course visible figures are important but he that would run his company on visible figures alone will in time have neither company nor figures. The most important figures are unknown and unknowable but successful management must nevertheless take account of them.”
His point is that we seem to be obsessed with trying to measure the effect of a given change (usually to ‘claim it’ for some recognition or even reward), but that we cannot accurately do so…and it is a mistake to think that we can. Sure, we can likely determine whether a change is having a positive or negative effect on the system (and thereby try to amplify or dampen it) but we cannot isolate the change from everything else going on (internally or externally; occurring right now, previously or in the future)
Deming went on to provide some examples of ‘important but unknowable’:
- The multiplying effect on sales that comes from a happy customer, and the opposite from an unhappy one;
- The improvement of quality and productivity from teamwork (across the horizontal value stream and with suppliers);
- The boost in quality and productivity all along a value stream from an improvement at any activity upstream;
- The loss from the annual rating of people’s performance (the time taken by everyone to perform this process and, of far greater concern, the resulting de-motivation and relational damage caused)
- …and so on
Deming famously wrote that “it is wrong to suppose that if you can’t measure it, you can’t manage it – a costly myth.”
 Example: Can I manage how employees feel? Yes, by how I behave.
Should I become obsessed with measuring employee feeling through those dreaded culture surveys? No!!!!
…just continue to manage how people feel – by constantly and consistently applying simple philosophies such as the most excellent “Humanity above Bureaucracy” (Buurtzorg).
Leave the constant crappy ‘surveying of the obvious’ to those organisations that (still) don’t get it.
The balanced scorecard was derived because of the major limitations of purely financial measures. However, we should not assume that such a tool is a definitive answer for what we need to manage.
Indeed, it causes damaging behaviours – with management wearing blinkers when focusing on the scorecard “because we’ve tied all our management instruments into it and therefore that’s all that counts round here.”
The highly limited and ‘helicopter view’ scorecard becomes a major part of the ‘wrong management system’ problem.
2. Balance:
This word is used as if we need to balance our focus on the four different quadrants, playing one off against the others as if they are counterbalances to keep in check.
But this isn’t the case. If we did a little bit of, say, learning and growth (e.g. developing our people) and/or customer focus but then said “whoa…steady on, not too much…we need to balance the financials” then we aren’t understanding the nature of the system….and we certainly don’t ‘get’ cause and effect.
A metaphor for business to help explain the point:
Let’s suppose that you keep breaking out in a nasty skin rash.
You could pour ice cold water on it, apply a lotion or scratch it…until it bleeds (ouch).
These actions might appear to alleviate the effects…but they are also likely to make things worse…and none of them have considered (let alone dealt with) the cause!
If you continue to ignore the cause and just treat the (currently visible) effects, things could escalate…with new effects presenting…complicating any necessary treatments…causing long lasting or permanent damage…and even death.
If you want to get rid of the rash…and keep it that way (and perhaps even improve your skin complexion and wider health)…then you need to focus your attention on its cause:
- are you reacting to something you are putting on your skin?
- what about something you eat, drink or otherwise introduce into your body?
- maybe it’s something else more complicated?
And once you’ve worked out the likely cause(s) then you need to do something about it.
You work on the cause (such as stop using that brand of sun cream or stop eating shell fish or…stop injecting heroin!!) whilst checking whether it is working by observing the effect (what the likes of Seddon and Johnson would refer to as ‘keeping the score’).
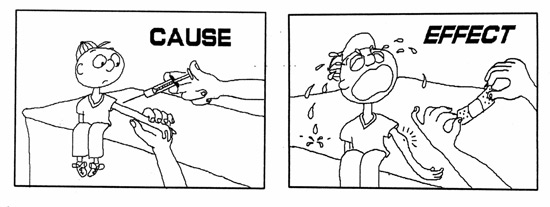
You don’t think “mmm, I’ll balance the cause and the effect”…because you understand the glaringly obvious definitions behind the words ‘cause’ and ‘effect’
“Cause: A person or thing that gives rise to an action, phenomenon, or condition
Effect: A change which is a result or consequence of an action or other cause.” (Oxford Dictionary)
Okay, back to that Balanced Scorecard/Strategy map thingy and a cause – effect journey:
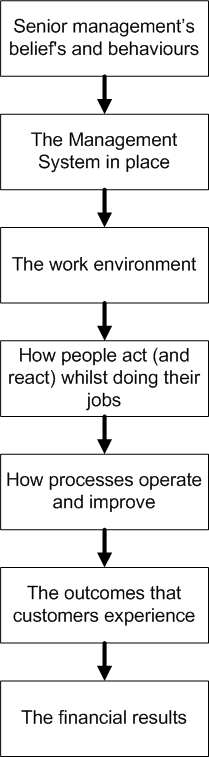 Senior Management’s beliefs and behaviours determine (i.e. cause) the management system that they choose to put into effect and (often stubbornly) retain;
- The management system creates (i.e. causes) much of the environment that the people work within (effect);
- The work environment is the foundation of (i.e. causes) how people act and react whilst doing their jobs (e.g. whether they are engaged, innovative, intrinsically motivated…or not);
- How people act influences (i.e. causes) how processes are operated and the nature, size and speed of their evolution (whether by continuous or breakthrough improvements);
- How processes operate and improve creates (i.e. causes) the outcomes that customers experience…and tell other potential customers about (i.e. as advocates or detractors);
- Customers (whether they buy from, and advocate for us or ignore, avoid and slag us off) determine (i.e. cause) whether we stay in business.
The bl00dy obvious point is that THE FINANCIALS ARE THE EFFECT! So why are we so focused on them, other than to keep the score5.
…or, in a short, snappy sentence: This isn’t something to be BALANCED!!!!!!!!
The ‘balanced’ word keeps people tied to a ‘manage by results’ mentality, rather than managing the causes of the results such that the results then look after themselves.
What winds me up even more than the balanced bit is….wait for it…applying % weightings on the four quadrants5….usually with the financials (yes, the effect) getting the lions share!
That’s like saying “We’ll focus 75% on scratching the rash but only 25% on taking fewer heroin injections”. Aaaargh!!!
Now, you might respond to me by saying you believe that Kaplan and Norton understood the problem with the ‘balanced’ word…which is why they, ahem, ‘refreshed’ their logic with their ‘Strategy Maps’ book.
The problem with this is that they didn’t attack the results thinking, they merely added to it and, as such, many (most?) organisations continue with balancing and weighting…and spectacularly missing the point.
3. Key Performance Indicators vs. Capability:
 Okay – let’s suppose that senior management accept that measures aren’t everything and that we shouldn’t be balancing (let alone weighting) things – I hope that we can all agree that some “right measures, measured right” (Inspector Guilfoyle) are going to be very useful…
…and so to the next whopper problem – the “measured right” bit.
Nothing (that I have seen) within the Balanced Scorecard/ Strategy Map logic reflects on, let alone deals with, the hugely important subject of variation and the need to always visualise measures over time.
Management simply use a set of KPIs on a ‘scorecard’ and look at their red down/ green up arrows against last period and/or their traffic lights against budget.
This is to completely ignore the dynamics of a system, and whether such movements are predictable or not….and therefore whether any special attention should be paid to them.
The Balanced Scorecard/Strategy Map approach can therefore create a set of Executives exhibiting the ‘God complex’ (as in “I have the answer!”) whilst being “fooled by randomness” (Taleb) – blissfully ignorant of the capability of their value streams (or processes within) and doing much damage by tampering.
and last, but by no means least…
4. Strategy vs. Purpose:
The underlying assumptions within the Balanced Scorecard/Strategy Map thinking would appear to be the conventional ‘shareholder value’ view of the world.
(I’ve previously written a 5-part serialised post on what I think about this….so I won’t repeat this here)
We get fed a feast of:
In short: The core problem (for me) with Kaplan and Norton’s two books is that, not only do they retain the problematic traditional command and control management system, focused on delivering shareholder value – they use it as their foundation to build upon.
It’s therefore no wonder that organisations carry on as before (doing the same crappy stuff), whilst waving their supposedly game-changing ‘Strategy Map’ around a lot.
Have you got hold of that cow? Good…now where’s my ceremonial knife?
To end: ‘having a go’ at me because I’m being so negative
You might shout back “okay you cynic…what would you do instead?!”
Well, I’m not going to be able to answer that in a paragraph – even Kaplan and Norton took two (rather verbose) books…and more than a decade in-between…to present their logic – but I’d suggest that, if you are curious, the 130+ posts on this site would go some way to expressing what I (and I believe my giants) think.
…and if you want to start at measurement then you might want to look here first.
Footnotes:
1. Knowledge based assets: Kaplan and Norton list the following as examples of assets that aren’t measured and managed by financial measures: employee capabilities, databases, information systems, customer relationships, quality, responsive processes, innovative products and services.
2. Measurement system remaining financially based: H. Thomas Johnson’s book ‘Relevance Regained’ makes clear that it wasn’t always so. Financial measures used as operational measures (a bad idea) only came into being from the 1950s onwards. Johnson refers to the period 1950s – 1980s as the ‘Dark Age of Relevance Lost’ and ‘Management by Remote Control’. I would argue that many an organisation hasn’t exited this period.
3. Big consultancies ‘cashing in’: I can (sadly) write this because I have first hand evidence – I was there! 😦
4. Bastardising the Strategy Map includes organisations changing the order of the four elements!!!
5. Financials: There’s a HUGE difference between a) using financial measures to keep the score (which would be good governance) and b) attempting to use them to make operational decisions! Using financials to make operational decisions is to attempt to ‘make the tail wag the dog’.
Yes, accountants should keep the score, for cash flow monitoring and assisting with longer term investment decisions…but accountants should not be attempting ‘remote control management’ of operations.
6. Weighting the elements of the scorecard: See, for example, fig. 9.8 in ‘The Balanced Scorecard’ (1996) and the related commentary.
7. Diversity: I understand that the cow is a holy animal to some. Please don’t be offended by my use of an English phrase in expressing my thinking – no real cows were harmed in the writing of this post…and no harm is intended to those living now, or in the future 🙂
 I regularly hear these title words around me – or words to that effect – and, depending on my mood, this makes me smile…or groan.


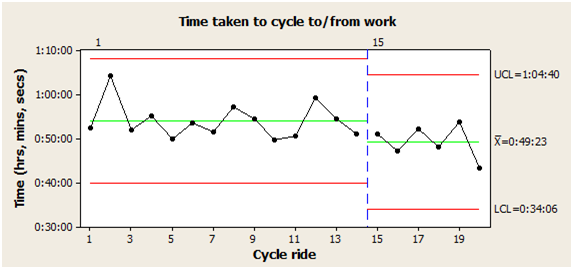
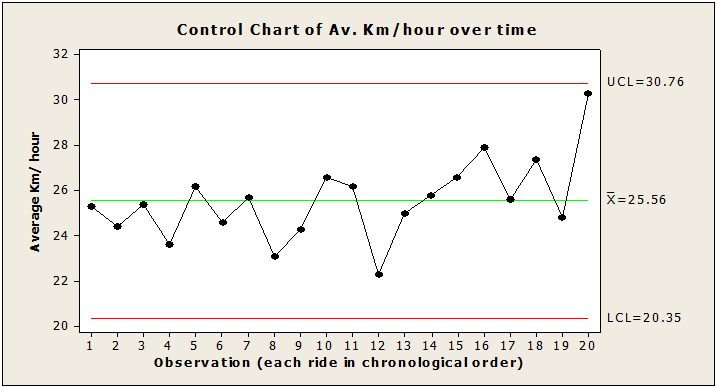
 So, a bloody good mate of mine manages a team that delivers an important public service – let’s call him Charlie. We have a weekly coffee after a challenging MAMIL 1 bike ride….and we thoroughly explore our (comedic) working lives.
 Inspection requires someone looking for something (whether positive or negative)…and this comes from a specification as to what they believe you should be doing and/or how you should be doing it.
 I’m a huge fan of a (deceptively) simple yet (potentially) revolutionary idea put forward by
  Before ending this post, I’d like to clarify that:
 So my son had some school exams and this post was triggered from a conversation I had with him just afterwards:
 There should be no surprise if the workers are merely clocking in, turning the wheel, collecting their pay and going home again. It’s what people end up doing when they are kept in the dark….though they likely didn’t
  However, ‘visual management’ should have a whopping big warning message plastered all over its box, that people would have to read before undoing the clasps and pushing back the lid…because visual management works for whatever you put up on the wall!